NT Government: Where have all the dollars gone?
2 February 2017
 By ERWIN CHLANDA
The question “where have all the dollars gone” has been asked countless times since self government came to the Northern Territory in 1978, usually followed by “Oh, when will they ever learn”.
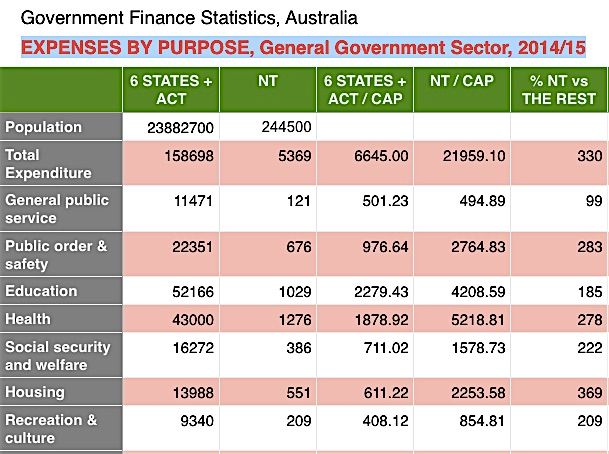
The short answer is, per head of population the Northern Territory government spends around three times as much – that’s 300% – when compared with the six states and the ACT.
Look at the right-hand column in our table (below) produced from Australian Bureau of Statistics data: The total expenditure is well over three times – 330%.
General public service funding is about line-ball (99%); public order and safety, nearly three times as much in the NT (283%); education nearly double; health nearly three times; social security and welfare more than double; housing almost four times (369%); with recreation and culture at double the other states’ spend.
These per capita numbers do not take into account funding for NGOs which are providing state-like services in the NT and are funded mostly by the Commonwealth. The Central Australian Aboriginal Congress, for example, a health service, has an annual budget of $41m.
These issues, plus welfare payments from the Commonwealth’s Centrelink, and the Grants Commission allocations to the NT (about five times the average national amount) will be the subject of later reports, as will social indicators, showing the results – good or bad – of this avalanche of public money sloshing around the NT.
Probing debate about government spending is usually discouraged or avoided because the community is complacent about getting a lot of someone else’s money, year after year.
Conversation soon trails off into “not everybody drinks excessively, you know” or “other places have crime as well” and so on. All this has little meaning without the numbers.
Here they are – hopefully creating some perspective.
TABLE below: “/ CAP” means per capita.

Source: Australian Bureau of Statistics


The table provided is self explanatory. Thank you Erwin / ABS. We spend too much and achieve less than other states and ACT per “head of cattle” – sorry, per capita.
What is not taken into account in the figures above is the population mix of the NT which differs from other states and ACT.
Statistics, by omitting or including one single factor, can show very different results.
I would like to see in the above another column (or two) showing the proportion of Aboriginal people living in the NT and that in the other states and ACT.
This will justify the higher expense percentage CAP in the NT.
In addition to my comment, I would like to give an idea of numbers. In all six states and ACT, the Aboriginal population is reaching 3% of a total population of about 24 million.
In the NT one third of a total 244,000 is Indigenous, that is 33%. One could then adjust the figures above. I just hope that my maths and stats are correct.