


Some expert answers to questions by 'the real people'
13 November 2012
The Great Alcohol Debate
By KIERAN FINNANE
 “There’s no such thing as alcohol ‘consumption’ statistics only sales statistics.”
“Per capita consumption stats are distorted by all the tourists who buy and drink in Alice Springs.”
“Per capita consumption stats are distorted by all the bush visitors who buy and drink in Alice Springs.”
“Per capita consumption stats don’t reflect all the people who buy their alcohol on-line.”
“The real people on the ground know the truth.”
In summary, these are the popular objections to the claims of a measure of success for restrictions on alcohol sales. The claims – based on statistical information – are that per capita consumption and hence alcohol-related harms have reduced in Alice Springs. It’s not certain that any rational approach could answer these objections – many people will believe what they want to believe, no matter what evidence is put before them. But the most recent expert study on alcohol and the various attempts over the years to reduce its harms in Central Australia does deal with these objections, first and foremost by extending the study focus to the whole of the Centre, not just Alice.
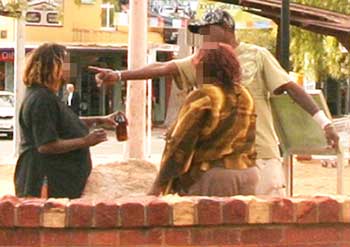
Pictured above: Police tipping out grog being consumed in a public place. The report found that declaration of Alice as a Dry Town did not have any significant effect on reducing consumption of alcohol. Photo from our archive, taken in early 2008.
The study, released last week, was headed up by five researchers from the National Drug Research Institute (NDRI), based at Curtin University in Perth, WA. Two medical doctors from the Northern Territory also contributed, Dr Steven Skov from NT Health and (dare I say it, for the name of this man is like a red flag to a bull for some of our readers) Dr John Boffa from Central Australian Aboriginal Congress.
Its title succinctly describes what it set out to do: A longitudinal study of influences on alcohol consumption and related harm in Central Australia: with a particular emphasis on the role of price. The period of the study was 2000 to 2010 (so we won’t find here an assessment of the effects of the Banned Drinker Register which rolled out from July 2011 and has never been the subject of an evaluation study).
Before looking at what the study found, let’s see how it dealt with the popular objections to what the experts say, as summarised above.
1. “There’s no such thing as alcohol ‘consumption’ statistics only sales statistics.”
This is true but using alcohol wholesale sales data as a proxy measure of alcohol consumption is consistent, says the report, with the methodology recommended for such evaluations by the World Health Organization’s International Guide for Monitoring Alcohol Consumption and Related Harm, as well as by a NDRI review.
2. “Per capita consumption stats are distorted by all tourists who buy and drink in Alice Springs.”
Tourists are in. They maximise the population count and thus provide a conservative measure.
Says the report: “Selecting the best estimate of population is important as it has the potential to either over- or under-estimate per capita rates of alcohol consumption, and rates of key indicators of harm.”
The authors follow convention and include all people aged 15 and over in their calculations, and as tourism is an important part of the NT economy, they say “it is also important to account for the contribution of tourists to levels of consumption”.
However, seasonal fluctuations “can mask real trends in the data” so the data were ‘de-seasonalised’ before they were subjected to time series analysis.
3. “Per capita consumption stats are distorted by all the bush visitors who buy and drink in Alice Springs.”
Visitors from the bush are in too.
 Says the report: “A proportion of the alcohol purchased in Alice Springs is consumed in areas adjacent to the town or is consumed in the town by people who are usually resident in those adjacent areas. For these reasons, simply estimating per capita consumption by dividing the volume of alcohol sold in the town by the residential population results in over-estimation. Thus, the geographic area we selected for study was the Central Australian region – that is, the Australian Bureau of Statistics Central NT Statistical Sub-Division (SD) – rather than the town of Alice Springs itself. This SD includes the Central Desert, MacDonnell, Yulara (previously known as Petermann), and Alice Springs and its constituent Statistical Local Areas (SLAs).”
The report uses Greater Darwin as the “control region” – an area with minimal additional alcohol restrictions during the study period and so providing a relevant point of comparison. “Accounting for the fact that alcohol sold in the city of Darwin may be consumed in surrounding areas”, the report similarly used Darwin City, Palmerston-East Arm and Litchfield Shire stats, referred to as ‘Greater Darwin’.
4. “Per capita consumption stats don’t reflect all the people who buy their alcohol on-line.”
The report’s authors are aware of this issue (the reference is to an Alice Springs News Online article). Here’s what they say:
“Recently, it has been argued that the wholesale sales data significantly underestimate the actual volume of sales, as they do not include sales made over the internet or mail order sales, which are used to circumvent licensing restrictions.
Detailed data on on-line sales of alcoholic beverages are not available. However Access Economics reported [in Household E-Commerce Activity and Trends in Australia, 2010] that these are estimated to account for 1.9 per cent of total sales
of alcoholic beverages in Australia.
“Within the Northern Territory, on-line sales by some large retailers are shipped internally and thus are included in sales data reported to the Licensing Commission. Where they are shipped from outside the NT they are not included. There is some observational evidence to suggest that on-line sales have been increasing. However, even if on-line sales in Central Australia were double the national average (unlikely), and none were captured in the Licensing Commission data, they would make little appreciable difference to estimates of consumption based on wholesale sales data.
“Furthermore, … the evidence from this study indicates that those who were unable to purchase cheap cask table and fortified wine shifted to full strength beer which was purchased locally.”
 How much grog enters Alice via the Post Office? And is it important to know?
The News put further questions on this issue to Professor Dennis Gray, one of the report’s authors and deputy director of the NDRI. We asked why, as Central Australia is unlike other parts of Australia in many ways, the national picture of on-line sales is to be accepted so readily? We also asked if a survey of residents would be a reasonable way of gathering data on the issue and how important he thinks this data would be?
Here is his reply: “Data on total on-line sales are captured in national figures, as wholesalers are required by law to provide these data for calculation of taxes and excise duties.
“The best source of what is shipped to regional areas is the records of the sellers. However, these are commercially sensitive and the seller will not provide them.
“A household survey could provide some indication, but such surveys on sensitive issues such as alcohol purchases and consumption are subject to considerable error (which is why wholesale sales data are much preferred as an estimate of consumption to household survey data).
 “In the report, we recognise that Central Australia is different in some ways. That’s why we made the point that even if on-line purchases were twice the national average – which is likely to be an overestimate given that the wholesale based estimates of consumption are running at about 30 per cent greater than the national average – it wouldn’t have much impact on the final estimate.
“The other issue is that a significant component of on-line purchases are for bottled table wine. Those who purchase this are likely to be substituting for local sales of bottled table wine which is not itself a major component of total sales. The NT Licensing data show that most of the substitution has been of beer for cask table and fortified wine and that purchasers of these latter products are the least likely to order alcohol over the internet.”
5. “The real people on the ground know the truth.”
If it’s accepted that people working in frontline positions dealing with alcohol issues are ‘real’, then the report consulted them. Says the report: “The meaning of statistical data is not inherent in the data themselves, they require interpretation. Such interpretation needs to be internally consistent with the data and consistent with evidence from other sources.
“To ensure that our final interpretation of the quantitative data was as robust as possible, after the preliminary analyses we conducted a series of semi-structured interviews with key informants. These informants included relevant senior staff and
officers from the Alice Springs Hospital, Royal Darwin Hospital and the NT Police as well as staff from Aboriginal community-controlled organisations such as Central Australian Aboriginal Congress.
“Our initial findings were described to them and they were asked to comment on these and to provide their interpretations. Records were made of these interviews and subjected to thematic analysis specifically aimed at identifying factors that might have confounded the findings of the Stage 1 statistical analyses or which might have confirmed or contradicted the interpretations of the results of those analyses. These qualitative data were then used to guide concurrent re-analysis of the quantitative data as part of Stage 3 of the project.”
So, what did the report find?
 It looked at nine control measures introduced during the decade studied, the most significant of which, in terms of their impact on reducing consumption, have been the Alice Springs Liquor Supply Plan (LSP) introduced in October 2006 and the raft of controls that became effective in 2008 including the national measure commonly known as the ‘alcopops tax’. The study concludes that the other control measures in this period “do not appear to have had any significant effects on consumption in Central Australia”. These include the alcohol-specific provisions of the Intervention and the declaration of Alice Springs as a ‘Dry Town’ (May 2007).
The 2008 controls included the introduction of the photographic ID system for purchase of alcohol in Alice, the rationale of which was to make enforceable to imposition of “one per person per day limits” set by the LSP. The study concludes however, by looking at what was happening in Greater Darwin at the same time, that the alcopops tax, rather than the ID system, was responsible for the observed decrease in per capita consumption in Central Australia (there was a decrease in Greater Darwin too, where at that time there was no ID system).
The most significant factor in the measures that have had an impact on lowering per capita consumption has been price, concludes the study. The LSP restrictions on high alcohol content, low-priced products – cask wine and fortified wine – has led to drinkers switching to lower alcohol content, more expensive full-strength beer. And the alcopops tax, making mixed spirit-based drinks dearer, led to a similar substitution.
So for this decade’s worth of effort, by how much has per capita consumption decreased? In Central Australia it went from an estimated 17.65 litres of pure alcohol per capita in 2000 to 13.75 in 2010, with the significant part of the decrease achieved after the LSP started, going from 15.8 litres in 2006 to 13.57 litres in 2007. The 2010 consumption figure is still 1.36 times the national figure of 10.13 litres per capita in 2010.
It is interesting to compare Central Australia’s figures with Greater Darwin’s, which have been going up, from 14.66 litres per capita in 2000 to 15.48 in 2010 (dropping from a high of 16.68 in 2008). Central Australia, widely thought to be the nation’s basket-case when it comes to grog, is actually doing better than Greater Darwin by a margin of 1.73 litres. Some might think that is cause for a modest celebration.
 And what about the reduction in harms (the whole point of reducing consumption)?
A key achievement of the controls exerted by the LSP would appear to be a reduction in the rates of assault recorded at the Alice Springs Hospital and emergency department.
Says the report: “A similar reduction was not observed in assaults recorded by Alice Springs Police but this was likely due to increased focus and awareness of police on alcohol-related issues leading to heightened detection and recording of assault incidents.
“The three different sources of data on assaults can be viewed as representing a continuum of severity. For instance: police reported assaults included a broad cross-section of seriousness including many minor incidents; ED presentations included serious injuries requiring further hospitalisation but also included less serious injuries which could be treated with minimal medical attention; and finally, assaultive injuries requiring hospitalisation (i.e. admission to a ward) are generally serious in nature.
“The Indigenous population of Central Australia, and women in particular, were clearly subject to higher levels of assaultive injury than their non-Indigenous counterparts. Introduction of the LSP reduced the rapidly increasing trend towards higher rates of assault among Indigenous women apparent from 2004 to 2006.”
The report recognises the general concern about levels of other crime and anti-social behavior. Looking at police data over the study period, the authors observed “extreme fluctuations in protective custody and drink driving incidents, and there had been statistically significant increases in domestic violence and protective custody incidents”.
They comment: “We were advised by officers from the NT Police that the frequency of these incidents was particularly susceptible to changes in policing policy and the allocation of resources and in the case of domestic violence to changes in the law. For these reasons, they advised that changes in the data were more likely to be indicative of Police activity than they were of the likely impact of restrictions.”
At the end of its 163 pages, the report concludes that while “price-related alcohol restrictions have had a significant effect in reducing alcohol consumption, [the evidence] also shows that price is not the only variable impacting upon levels of consumption and related-harm”. Thus restrictions reducing consumption have to be part of a comprehensive strategy that also aims to reduce harms and demand.
Says the report: “It is important that demand reduction strategies not be conceived too narrowly. As well as focusing on
interventions specifically targeting alcohol use, such as prevention and health promotion, demand reduction strategies need also to focus on broad-based interventions which address the underlying social determinants of health and alcohol and other drug use, including early childhood development, education and employment programs.”
For those who want to wrestle with the nuance of all this analysis, the whole report can be found here.
The inclusion of the average tourist numbers and total bush community population in this longitudinal analysis makes it a strong document.
However, it would be a mistake to become complacent about the excessive consumption/excessive harms issues on the basis of the significant improvement shown by the drop in average alcohol consumption and containment of growth in serious assaults demonstrated during this period. The reason is this: the fact is that the alcohol-consuming proportion of many remote communities’ populations is still relatively low (previous surveys indicate it may be only about half the rate of the mainstream population, as it includes many people who have never drunk alcohol as well as disproportionate numbers who have drunk but given it away). This then means that whilst the actual average consumption levels of central Australian drinkers has fallen dramatically as a result of the reforms of the last six years, its real level remains higher than any sensible person would want, and is masked by the unusually high numbers of non-drinkers.
I also suspect that the number of non-drinkers in the central Australian study area would be substantially greater than that of the Darwin-Palmerston-Litchfield ‘Control Region’, which does not include a large number of similar ‘dry’ bush communities.
The lesson: despite the fact that our reforms have greatly reduced the over-all amount of harmful drinking, there is nonetheless still quite a bit of harmful drinking about, as our average consumption level is still 30% above the national average, and our large cohort of problematic drinkers are drinking at levels very much above the national average.